
RB2B AI: ASK US ANYTHING
Understanding your website visitor demographics helps you prioritize who to reach out to and who to engage further. This guide breaks down six actionable ways to uncover that information. Among them, RB2B’s individual-level identification provides the closest view of real buyer-level demographics.
Getting eyeballs on your website, but don't know who’s behind those visits?
That's a valuable pipeline you are leaving on the table every day. And it's painful considering all the effort you've invested in generating demand.
This article shares six practical ways to turn anonymous website traffic into meaningful demographic insights. You'll learn how to go beyond demographics with firmographic and behavioral data, so you can identify not just who's visiting your website, but which visitors are most likely to become customers.
At RB2B, website visitor identification is what we do. Our platform helps over 100,000 B2B businesses unmask anonymous website visitors down to the individual level.

This guide is informed by our deep experience in the field.
Demographic data refers to the characteristics used to describe a person or audience. This can include attributes like age, gender, location, occupation, job title, seniority, and income level, depending on the context.
Website visitor demographics simply refer to these same characteristics, but for the people who have already visited your website. For example, you might discover that a website visitor is a Marketing Director working at a 500-person SaaS company in California. These insights help you understand who your website is attracting and whether they fit your ideal customer profile.
Unmasking your website visitors is necessary as not every one of them is a potential customer. While some might be a strong fit for your product, others may be irrelevant, unqualified, or simply not in a buying position.
Having visitor demographics helps you quickly separate high-fit prospects from everyone else. Instead of treating all traffic the same, you can focus your time and effort on the people who actually match your ideal customer profile, improving both efficiency and conversion outcomes.
Here are six practical methods you can use to uncover the demographics of your website visitors. Each approach gives you a different level of visibility into who is interacting with your site and how meaningful that traffic actually is. Let's expand on each:
Google Analytics (GA4) is one of the most widely used tools for understanding website traffic behavior and audience composition. It provides aggregated demographic insights based on modeled and consented user data.
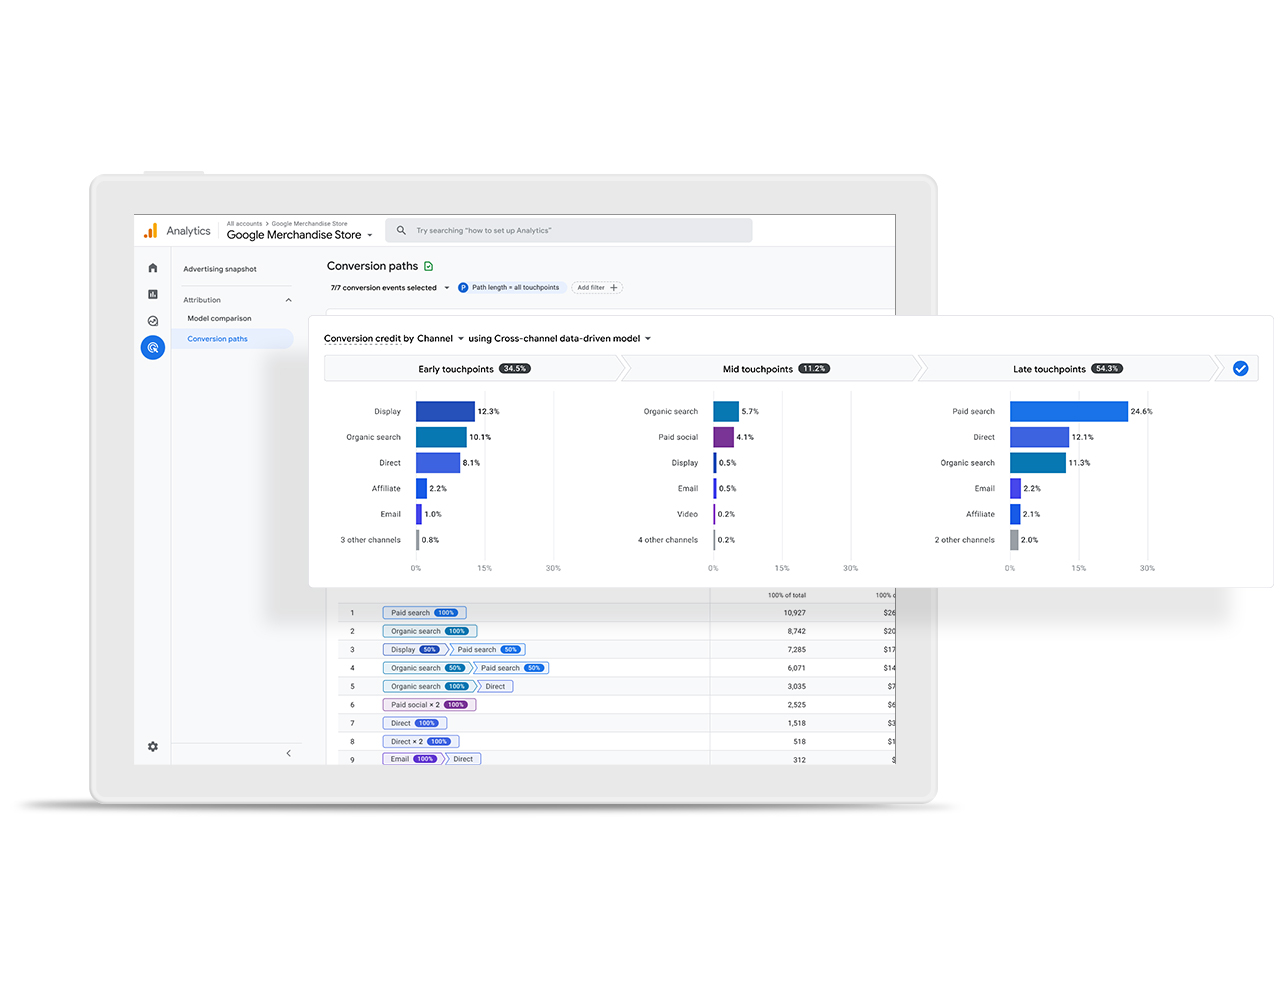
Google Analytics works by collecting behavioral signals through a tracking script installed on your website. Once implemented, GA4 records events like page views, scrolls, clicks, and session duration. When Google Signals is enabled, it enriches this data using logged-in Google accounts to infer demographic attributes such as age range, gender, interests, device type, and geographic location.
Your GA4 dashboard typically shows estimated age, gender, and geographic distribution, along with interest categories based on browsing behavior, device and platform usage, and engagement patterns across pages and sessions.
This helps you understand who your audience likely is at a macro level, especially when analyzing trends over time.
To set up GA4, add the tracking tag to your site header either via Google Tag Manager or directly. Then:
Once configured, demographic reports begin populating within a few days to weeks, depending on traffic volume.
The main limitation of GA4 is that it does not identify the actual company or person behind a visit. Instead, it extrapolates demographic patterns from aggregated data. This means you are working with estimates rather than real visitor identities.
In practice, you can understand who is likely visiting your site, but not who actually visited. For sales and outbound teams, this significantly reduces actionability because you cannot tie interest to specific people or accounts.
Account-based marketing tools like 6sense, Demandbase, and Albacross identify the companies visiting your website through reverse IP lookup. They tell you which company your traffic is coming from, along with firmographic data like the industry, company size, revenue range, and location.
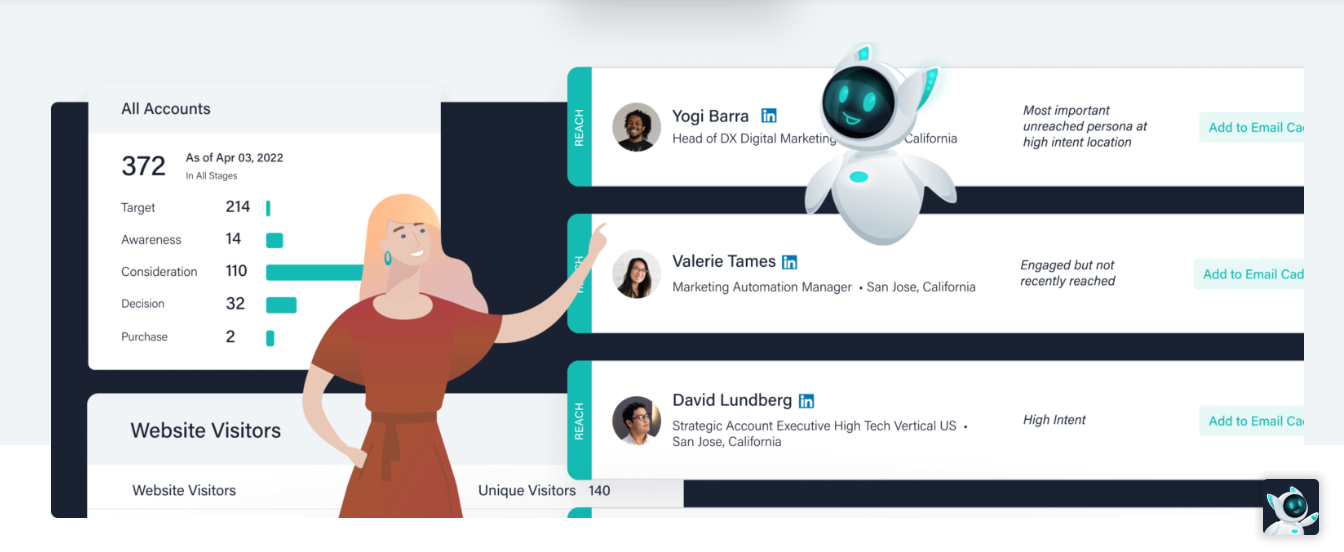
These tools work by matching IP addresses from your website traffic to known business IP databases. Once a match is found, the visit is attributed to that organization, allowing your sales team to prioritize accounts already showing interest.
These platforms typically provide:
To set up these tools, you install a tracking script on your website. Once active, the platform begins monitoring incoming traffic and matching IP addresses to its company database.
From there, you can:
Over time, the system builds a clearer picture of which companies are consistently interacting with your brand and which pages are driving the most interest.
Visibility stops at the company level. While you can see which organization is visiting your website, you have no idea who within that company is actually behind the visit.
This creates a gap in clarity and action. You don’t know whether the traffic came from a decision-maker, a junior team member, or someone completely outside your buying committee. As a result, you still have to identify the right person manually, often reaching out to multiple people before finding the relevant decision-maker.
LinkedIn Website Demographics is a reporting feature within LinkedIn Campaign Manager that shows aggregate insights about the people visiting your website. It breaks down your audience based on their professional attributes.
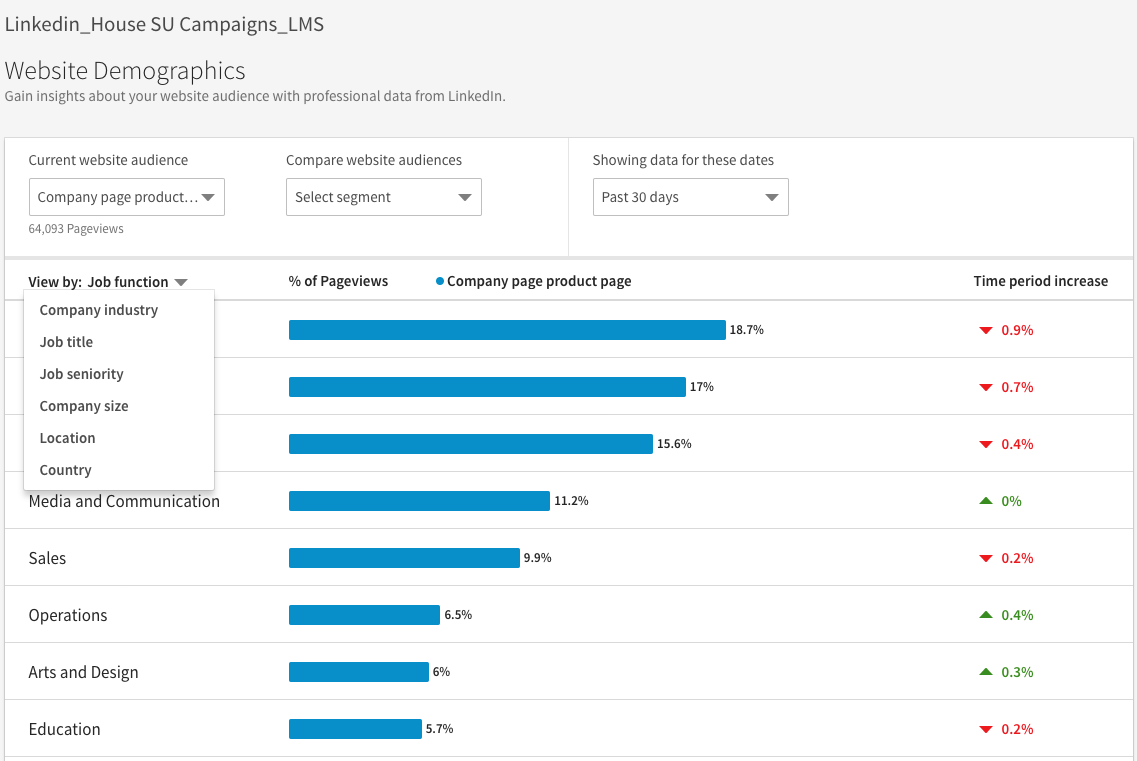
It works by using the LinkedIn Insight Tag installed on your website. Once implemented, the tag tracks visitor activity and matches it against logged-in LinkedIn user profiles. Over time, LinkedIn builds an aggregated view of the types of professionals engaging with your site.
This tool typically provides the following inferred information about your website visitors:
This helps you understand the professional makeup of your overall website audience and whether you are attracting the right type of decision-makers.
To activate this feature, you need to install the LinkedIn Insight Tag on your website. Once installed, you configure it inside LinkedIn Campaign Manager and allow data to accumulate over time.
From there, you can:
As traffic builds, the system becomes more accurate in showing patterns in the professional makeup of your audience.
All insights are aggregated, meaning you can’t see individual visitors or connect demographic data to a specific person who visited your website. You also can’t identify when prospects visited or what they did on your site as an individual.
So, just like GA4, you have data that tell you what kind of people, but not who that visitor is so you can engage or reach out immediately.
Heatmap tools like Hotjar, Microsoft Clarity, and Crazy Egg are primarily used to visualize how visitors interact with your website. They show where users click, how far they scroll, and which sections of a page receive the most attention.
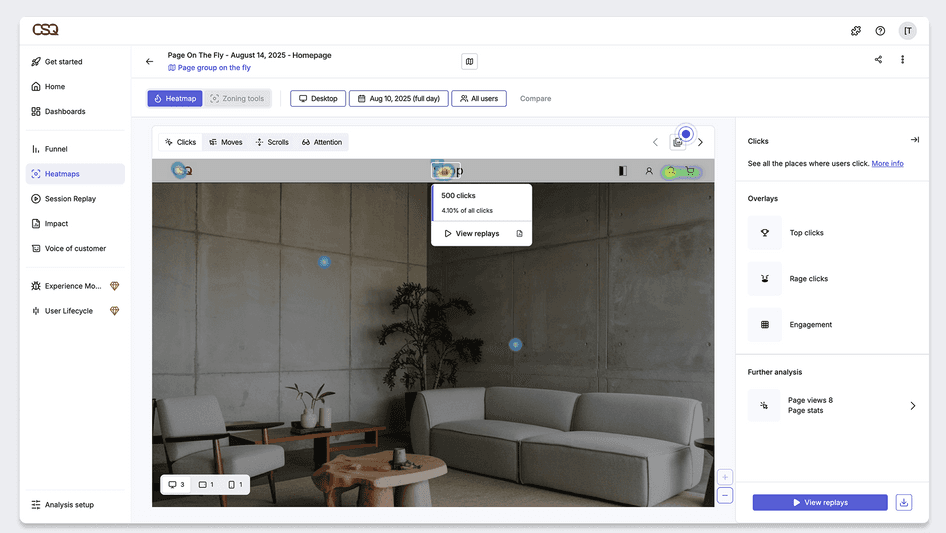
But aside from that, some of these tools also provide basic visitor context such as device type, browser, and approximate geographic location.
These tools mostly track website behavior metrics. The only demographic info they give is geography.
Setup usually involves installing a tracking script or plugin on your website. Once installed, the tool automatically begins recording visitor sessions and generating heatmaps over time. This can then be used to extrapolate the locations of those visitors.
Demographic insights are limited and indirect. While you may get rough geographic information or device-level context, these tools do not provide detailed or reliable demographic profiles of your visitors.
At best, they help you infer general regional or behavioral trends, but they cannot tell you who the visitor is, what company they belong to, or whether they fit your ideal customer profile. This makes them useful for improving on-site experience, but not for personalized outreach.
Instead of trying to infer visitor demographics through tools, on-site surveys take a more direct approach by asking visitors to share information themselves while they are on your website. These typically appear as pop-ups, slide-ins, or embedded forms that trigger based on user behavior such as time spent on a page or exit intent.

The idea is simple: if you want to understand who is visiting your site, you ask them directly. These surveys are usually powered by tools like Typeform or Qualaroo, and can be customized to collect demographic or firmographic information depending on your goal.
On-site surveys can capture:
This makes it one of the few methods that can provide self-reported, first-party demographic data directly from visitors.
Setup typically involves installing a survey tool script on your website and defining when and where surveys should appear.
From there, you can:
Over time, this allows you to build a clearer picture of who is engaging with your website and why.
These methods rely entirely on visitors choosing to respond, and most users tend to ignore or dismiss surveys altogether. Even when responses are collected, they are self-reported and incomplete, meaning you may not get consistent coverage across your traffic.
You might end up only seeing a small, selective portion of your audience, which makes it difficult to build a complete or reliable demographic view of your website visitors.
This is the most advanced approach adopted by smart B2B teams. Instead of estimating demographics, aggregating data, or relying on company-level signals, these tools identify real individuals visiting your website.
They take anonymous traffic and resolve it into actual people, showing you who they are, where they work, and how they are interacting with your site in real time. This removes much of the guesswork present in the earlier methods and shifts the focus from “what type of visitor is this?” to “exactly who is this person?”
One of the clearest examples of this category is RB2B.
RB2B works by identifying individual website visitors and connecting them to verified professional profiles. Instead of stopping at aggregated or company-level data, it reveals person-level identity tied to real browsing behavior.

This solves the core limitations seen in previous methods:
Instead, it combines identity + behavior, allowing teams to see both who the visitor is and what they did on the website.
RB2B typically provides:
This allows your team to act immediately when high-intent visitors show up, instead of working from delayed or incomplete data.
Start using RB2B by installing our script in the header of your website. Once that’s done, RB2B begins sending you live website visitor data in as little as 5 minutes. Over time, this creates a live feed of high-intent prospects already engaging with your website.
RB2B does individual level website visitor identification for only US-based visitors.
Understanding your website visitors is useful, but only if it leads to action. As we’ve seen, most of these traditional demographic tools help you analyze traffic, but they typically stop at aggregated insights or company-level data, leaving you to guess who is actually behind each visit.
RB2B closes that gap by identifying individual website visitors in real time, turning anonymous traffic into named, high-intent prospects your team can engage immediately.
If your website is already generating demand, don't let those opportunities remain invisible. Sign up for RB2B today to start turning those anonymous website visitors into pipeline.
Alert your reps, start automated outreach, and add to lead score in under five minutes.

